All charts and tables below reflect the data release on 6/18/2021 from the VAERS website, which includes U.S. and foreign data, and is updated through: 6/11/2021
| High-Level Summary | COVID19 vaccines (Dec’2020 – present) | All other vaccines 2004-present | All other vaccines 1990-present |
|---|---|---|---|
| Number of Adverse Reactions | 358,378 | 631,626 | 807,207 |
| Number of Life-Threatening Events | 6,156 | 9,594 | 13,200 |
| Number of Hospitalizations | 20,737 | 59,150 | 77,017 |
| Number of Deaths | 5,993* | 6,042* | 8,753 |
| # of Permanent Disabilities after vaccination | 4,874 | 13,187 | 18,623 |
| Number of Office Visits | 65,621 | 40,975 | 41,046 |
| # of Emergency Room/Department Visits | 47,791 | 141,830 | 208,289 |
| # of Birth Defects after vaccination | 183 | 121 | 123 |
Deaths


Chart using comparable 6 month periods, since Covid-19 vaccines have only been available for approximately 6 months:


Adverse Events

Chart using comparable 6 month periods, since Covid-19 vaccines have only been available for approximately 6 months:

Symptoms
The slide below was taken from an FDA document from October 22, 2020 and provides a list of possible adverse event outcomes related to the Covid-19 vaccines.
- Source: ‘Vaccines and Related Biological Products Advisory Committee October 22,2020 Meeting Presentation”.
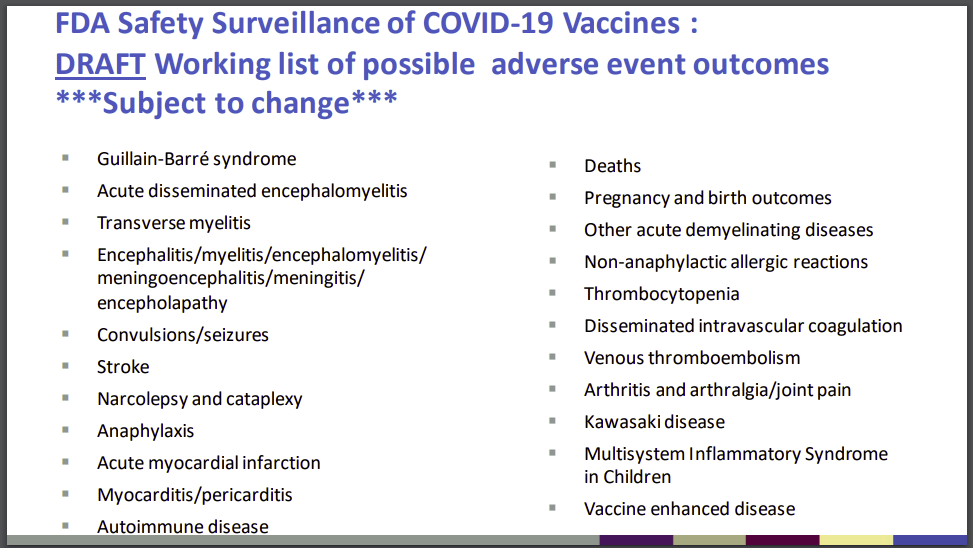
The following table lists the number of adverse events found in the VAERS data which match the outcomes listed above:
| FDA Listed Symptom | Total (Non-Lethal) Adverse Events | Total Deaths |
|---|---|---|
| Guillain-Barre | 335 | 7 |
| Acute Disseminated Encephalomyelitis | 19 | 0 |
| Transverse Myelitis | 116 | 0 |
| Encephalitis | 323 | 38 |
| Convulsions/Seizures | 3759 | 99 |
| Stroke | 3218 | 288 |
| Narcolepsy, Cataplexy | 45 | 0 |
| Anaphylaxis | 17582 | 44 |
| Acute Myocardial Infarction (Heart Attack) | 823 | 266 |
| Myocarditis/Pericarditis | 1117 | 8 |
| Autoimmune Disease | 184 | 7 |
| Other Acute Demyelinating Diseases | 48 | 1 |
| Pregnancy and birth outcomes (Miscarriages) | 699 | 8 |
| Other Allergic Reactions | 450 | 0 |
| Thrombocytopenia | 610 | 55 |
| Disseminated Intravascular Coagulation | 32 | 13 |
| Venous Thromboembolism | 4082 | 196 |
| Arthritis and Arthralgia/Joint Pain | 22617 | 39 |
| Kawasaki Disease | 7 | 0 |
| Systemic Inflammatory Response Syndrome | 162 | 7 |
Vaccination Related Risks of COVID19 Vs. Flu
These set of figures compare the COVID19 vaccine to the traditional Flu vaccines. ‘Risk of Death’ percentages depend on the ‘# of Vaccinations’ data, which is only approximate, and was pulled from the CDC’s report on Flu vaccination coverage for the 2019-2020 season, and from Our World in Data for the COVID19 vaccinations.
Covid19 vaccinations through 5/31/2021 vs. Flu vaccinations 7/1/2019 – 5/31/2020 (last complete flu season)
| Vaccine Type | # of Vaccinations | # of Deaths | Risk of Death | Percentage |
|---|---|---|---|---|
| Flu | 167,447,642[1] | 91 | 1 in 1,840,083 | 0.000054% |
| COVID19 | 167,733,972[2] | 5,863 | 1 in 28,609 | 0.003495% |
| Vaccine Type | # of Vaccinations | # of Adverse Reactions | Risk of Adverse Reaction | Percentage |
|---|---|---|---|---|
| Flu | 167,447,642 | 10,431 | 1 in 16,053 | 0.006229% |
| COVID19 | 167,733,972 | 327,579 | 1 in 512 | 0.1953% |
[1] number of flu vaccinations based on estimated flu vaccine coverage data from CDC and estimated population data from US Census. Yearly flu vaccination data covers a period of time from 7/1 to 5/31 of the following year.
[2] number of covid19 vaccinations based on estimates from Our World in Data

Vaccine Data by Manufacturer
| Manufacturer | # of Deaths | % Deaths | Average Deaths/Day | Days since EUA approval | EUA Approval Date- |
|---|---|---|---|---|---|
| Janssen (JNJ) | 410 | 6.84% | 3.9 | 105 | 2/26/2021 |
| Moderna | 2278 | 37.99% | 13.02 | 175 | 12/18/2020 |
| Pfizer/Biontech | 3282 | 54.73% | 18.03 | 182 | 12/11/2020 |
| Unknown | 27 | 0.45% |
| Manufacturer | # of Adverse Events | % AEs | Average AEs/Day | Days since EUA approval | EUA Approval Date |
|---|---|---|---|---|---|
| Janssen (JNJ) | 39366 | 10.98% | 374.91 | 105 | 2/26/2021 |
| Moderna | 164363 | 45.83% | 939.22 | 175 | 12/18/2020 |
| Pfizer/Biontech | 154011 | 42.94% | 846.21 | 182 | 12/11/2020 |
| Unknown | 932 | 0.26% |
Vaccine Data by Gender

I’m more than happy to find this website. I want to to thank you for your time for this wonderful read!! I definitely loved every little bit of it and I have you saved as a favorite to see new stuff on your site.
Thanks Alana! More than happy to expose what is not being reported by our government and health regulatory agencies.
Your blog won’t show up appropriately on my apple iphone – you may want to try and fix that
Thanks, will have to check it out on an iphone when I get a chance…since the site is heavily data-based, it will certainly look better on a bigger screen, like on a laptop.
Hey I am so glad I found your blog, I really found you by mistake, while I was browsing on Askjeeve for something else, Regardless I am here now and would just like to say many thanks for a fantastic post and a all round exciting blog (I also love the theme/design), I don’t have time to read through it all at the minute but I have book-marked it and also included your RSS feeds, so when I have time I will be back to read a great deal more, Please do keep up the awesome job.
Thanks Sabra!
I love looking through a post that will make people think. Also, many thanks for permitting me to comment!
Hi Kai, You’re welcome!